 TRACE MODE® 6 provides control system developer with advanced debugging tools aimed to increase productivity at all stages of project development – starting with simplest algorithms, up to the "live" process tuning at the project commissioning stage. The debugging tools were given special attention in the TRACE MODE® 6. The thoroughly selected debugging technologies reduce time-to-market and ensure high reliability of control systems. TRACE MODE® 6 provides control system developer with advanced debugging tools aimed to increase productivity at all stages of project development – starting with simplest algorithms, up to the "live" process tuning at the project commissioning stage. The debugging tools were given special attention in the TRACE MODE® 6. The thoroughly selected debugging technologies reduce time-to-market and ensure high reliability of control systems.
The TRACE MODE® 6 control system debugging tools are subdivided into the following groups:
- debuggers of the control system project components, integrated with the respective editors of the TRACE MODE® 6 development environment;
- real-time debugging tools, allowing to monitor operation of the TRACE MODE® 6 and T-FACTORY 6 runtimes in the project execution mode;
- tools for the control system diagnostics in the operating mode.
The first group includes:
o Techno FBD;
o Techno LD;
o Techno ST;
o Techno IL;
o Techno SFC;
- graphics emulator, built-in into the Graphic editor;
- report templates debugger;
- SQL-queries debugger.
The second group includes:
- real-time debugger (profiler) – special TRACE MODE® 6 runtime delivered with IDE;
- SPY – the remote debugger for distributed control system project, built in the TRACE MODE® 6 development system.
The control system debugging in TRACE MODE® 6 is performed in several stages:
1. Program debugging in editors of the development system;
2. SQL-queries debugging in SQL-builder;
3. Debugging of programs and SQL-queries interaction at the single project node with no connection to PLC;
4. Distributed control system network emulation on a single PC: debugging of interaction between different project nodes on a single PC;
5. Debugging of data exchange with PLC;
6. Local debugging at the control system setup stage: debugging of each project node under profiler;
7. Global debugging at the control system setup stage: debugging of the distributed control system operating in real time from a remote workstation in the SPY (monitoring) mode.
Together with control algorithms and control loops debugging, the HMI visualization and alarm reports are usually debugged. Templates of documents and reports can be created and debugged independently from the main part of TRACE MODE® 6 project, but their final debugging is performed, as a rule, after launching the control system in trial operation, when it becomes possible to obtain real data archives from the SIAD/SQL 6 real time database and alarm reports.
Debugging of Programs Written in IEC 61131-3 Standard Languages
 Debuggers for IEC 61131-3 standard programs are built in the development system editors. All TRACE MODE® 6 debuggers have uniform program interface – debugger’s toolbar is intuitive to any programmer. Debugging can be performed in one of the following modes: Debuggers for IEC 61131-3 standard programs are built in the development system editors. All TRACE MODE® 6 debuggers have uniform program interface – debugger’s toolbar is intuitive to any programmer. Debugging can be performed in one of the following modes:
- step-by-step command execution – in textual languages one row of the code is executed, and in visual languages – one functional block;
- continuous execution of program – entire program is executed;
- cyclic execution – the program is executed without stops, after the last command is completed, the first one is executed again.
In all debugging modes the approximate time of program execution in microseconds is displayed. Therefore developer may compare efficiency of algorithms and to optimize them.
 For programs written in any IEC 61131-3 languages breakpoints can be set. For better navigation in editors bookmarks are available. In procedural languages the bookmarks and breakpoints are highlighted with symbolic color marks, and for visual languages, a functional block is marked with color. Blue color is used to highlight bookmarks and the red color – breakpoints. Green color is used to highlight the currently executed command – a row or functional block. For programs written in any IEC 61131-3 languages breakpoints can be set. For better navigation in editors bookmarks are available. In procedural languages the bookmarks and breakpoints are highlighted with symbolic color marks, and for visual languages, a functional block is marked with color. Blue color is used to highlight bookmarks and the red color – breakpoints. Green color is used to highlight the currently executed command – a row or functional block.
In the settings of the development system for IEC 61131-3 program debuggers it is possible to specify stack depth for functions call, set an option of internal variables display in the window, change delay value for cyclic execution of the program.
While debugging the visual programs, the current value is displayed near each input and output of functional block.
The TRACE MODE® 6 supports on line FBD-programs debugging with real-time data. Clicking the button of on-line debugging, the user obtains real values of inputs and outputs of the FBD-blocks, received from controllers. Upon quitting the on-line mode, one can continue debugging in the mode of emulation (manual debugging), while using the data loaded from real I/O device.
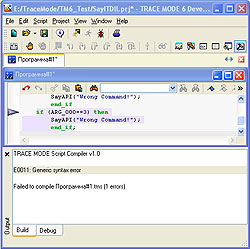
Compilation of textual programming languages will not necessarily be finished successfully. In that case, in the debug window the list of errors will be displayed, instead of computed time of program execution. Double-clicking on the error message, one may shift to the program line, containing the error. As a rule, no additional information is required for correction of the error, because syntax of IEC 61131-3 languages is much easier than the syntax of the common high level languages, such as C ++.
 Debugger may also process the nested subprogram, written in any of 5 languages. In the step-by-step execution mode, debugger can process function in one step, or execute each of its commands. If an error in the nested function written in Techno ST has been found during compilation, the debugger, upon double-click on the error message, would open the initial text of this function. Debugger may also process the nested subprogram, written in any of 5 languages. In the step-by-step execution mode, debugger can process function in one step, or execute each of its commands. If an error in the nested function written in Techno ST has been found during compilation, the debugger, upon double-click on the error message, would open the initial text of this function.
While developing a distributed control system with remote I/O or PLC, up to 70% of engineering time may be spend on transfer of edited programs onto remote controllers and PCs. The TRACE MODE® 6 remote download system saves developer’s time and rise productivity. The edited project may be downloaded into PCs and controllers of the control system by network directly from the TRACE MODE® 6 IDE by simple mouseclicking.
Thus, TRACE MODE® 6 offers a perfect toolset for debugging of programs written in IEC 61131-3 languages. These tools are intuitive to both experienced control system programmer and to beginner. All functions of debuggers are documented and provided with pop-up help.
Debugging of Other Project Components
 Debugger of HMI screen templates is arranged utterly easily: it allows debugging HMI screen animation in the emulation mode with on connection to the control system data sources. The emulation mode is run by clicking a button in the graphical editor. During debugging, one can manually change values of any variables (arguments) of the HMI screen, thus simulating the sources of data. Emulator of graphical HMI screen is a perfect tool for debugging of the screen logics, alarms and vector transformations over graphical objects. Debugger of HMI screen templates is arranged utterly easily: it allows debugging HMI screen animation in the emulation mode with on connection to the control system data sources. The emulation mode is run by clicking a button in the graphical editor. During debugging, one can manually change values of any variables (arguments) of the HMI screen, thus simulating the sources of data. Emulator of graphical HMI screen is a perfect tool for debugging of the screen logics, alarms and vector transformations over graphical objects.
 Debugger of report templates checks correctness of html-code of the document template and allows to emulate how a report will look in the real time. Since the report generation does not affect operation of real-time servers, the preliminary debugging can be omitted, and debugging may be performed directly on the working control system. Debugger of report templates checks correctness of html-code of the document template and allows to emulate how a report will look in the real time. Since the report generation does not affect operation of real-time servers, the preliminary debugging can be omitted, and debugging may be performed directly on the working control system.
Debugger of SQL-queries represents a full-scale ODBC client. Results of processing of queries are displayed in a special window. In case where no connection to a real database is possible, the debugger of SQL-queries simply checks syntax correctness.
One of the most interesting TRACE MODE debugging feature is the distributed control system debugging and network emulation on a single computer. It has become possible due to the ‘technology centered’ style of development in the TRACE MODE® 6. All the channels and programs of the distributed proje ct can be run on one virtual technological node with keeping all links, initial values, periods of translation, etc. At that, it would be expedient to allocate each project in an individual group. The technological node can be debugged in the profiler with data sources emulation algorithms. Upon completion of debugging, content of each groups-nodes of the technological node is transferred back to the appropriate real nodes (controllers or PCs) of the distributed control system by simple drag-n-drop. It is clear that all connections between channels of different nodes of one project would be saved. ct can be run on one virtual technological node with keeping all links, initial values, periods of translation, etc. At that, it would be expedient to allocate each project in an individual group. The technological node can be debugged in the profiler with data sources emulation algorithms. Upon completion of debugging, content of each groups-nodes of the technological node is transferred back to the appropriate real nodes (controllers or PCs) of the distributed control system by simple drag-n-drop. It is clear that all connections between channels of different nodes of one project would be saved.
Thus, the developer obtains a unique possibility of debugging of the entire distributed control system within TRACE MODE® 6 development system only.
Debugging and Project Diagnostics at The Trial Operation Stage
Local Debugging of Distributed Control System on a Single PC
An important stage of control system debugging is done while the TRACE MODE® 6 control system project is run in the real-time debugging monitor – profiler. The profiler differs from ordinary runtime – RTM by a number of additional features.
 The most commonly used one is the components view window, called from the View menu. It provides the real time mode debugging of mathematical data processing on a single project node (on a single PC) as follows: The most commonly used one is the components view window, called from the View menu. It provides the real time mode debugging of mathematical data processing on a single project node (on a single PC) as follows:
- displaying of all channels of the given node and their current real values;
- displaying of all attributes of the selected channel and their real values;
- inputting a value into any channel attribute;
- displaying of users, connected to the given node;
- indication of network activity of all nodes of the project.
Thus, the developer obtains a powerful facility for local debugging of all programs and data flows of a distributed control system done on a single PC. If desired, the developer can switch off connections between the channels and data sources of the TRACE MODE® 6 project and perform node debugging while simulating the various conditions of the process.
Another important profiler feature is the profiler self debug protocol logging in the real-time operation. Profiler protocol is saved in a text file. The information included in the protocol is determined by the profiler settings. At maximum, messages of 16 different categories can be included in the protocol. Among then the results of loading of the resource libraries at startup, each variation in channel attributes etc.
Debugging in the profiler can be performed in connection to either actual devices, or to the virtual data sources. The control system designer can set up algorithms of devices emulation, or use one of the simplest signal generators available in TRACE MODE® 6. Each data source is set up individually for operation with an actual device and with emulator. I.e. it is not necessary to emulate all signals - it is possible to adjust a part of channels for operation with actual equipment. Furthermore, each data source can be linked to several emulators, that is, a number of debugging processes can be created.
Emulation is activated by a single option of the development environment in the project settings, therefore no re-linking whatsoever would be required in transition of the control system to the trial operation . Moreover developer may at any time roll back to the debugging with virtual data sources.
Global Debugging of Distributed Control System
The final stage of the control system project debugging in real time is provided with the original SPY debugger available in the development system. The SPY debugger has been developed specially for large-scale distributed control system projects debugging at the trial operation mode, but it can also be used as debugging facility for minor control system and manufacturing automation consisting of one node. The SPY Debugger allows connecting remotely via TCP/IP network to any operating project node (PC or controller) obtaining detailed information about the values of any attributes of channels in any node, and in real time mode.
 Operation of the SPY debugger does not affect the operation of TRACE MODE® 6 servers. Users should not be afraid of an unauthorized access to the system through the SPY, because connecting to the operating project could only be possible if it has been configured correspondingly in the IDE. Otherwise, its operation would be blocked by the TRACE MODE® 6 security system. Operation of the SPY debugger does not affect the operation of TRACE MODE® 6 servers. Users should not be afraid of an unauthorized access to the system through the SPY, because connecting to the operating project could only be possible if it has been configured correspondingly in the IDE. Otherwise, its operation would be blocked by the TRACE MODE® 6 security system.
The SPY mode is activated at one click of the mouse in the main toolbar of the development environment. It is displayed in a special window, subdivided into two panels. In the left panel, the project tree is displayed, containing all nodes, groups of components and channels, in front of which their current actual values are displayed. With selecting of any channel, the right-hand panel of the SPY window displays a list of all its attributes along with their values. The original SPY debugger makes it possible to simultaneously monitor the dynamics of values in the channels of different nodes of one TRACE MODE® 6 project, which provides unrivaled debug opportunity and cuts the control system setup and trial operation time.
The SPY debugging tools are not restricted to passive monitoring. Using the SPY, one can change values of any parameters of the system in real time mode. This enables the setup engineers to perform fast and efficient debugging of any algorithms of distributed control system, as well as field devices and network connections with the matchless efficiency and without leaving their office.
No more need to draw tables containing setup coefficients for adjustment of sophisticated control loops, the TRACE MODE® 6 debugging tools provide immediate access to all project data without any efforts whatsoever, from the user.
Thus, for each stage of control system development TRACE MODE® 6 provides the systems integrator with powerful and handy project debugging tools complying with all up-to-date requirements for convenience and efficiency. |